For this week’s selection and also over the next couple of weeks we will review how the FMCG landscape has changed (or not) over the past three turbulent years.
We start with market structure.
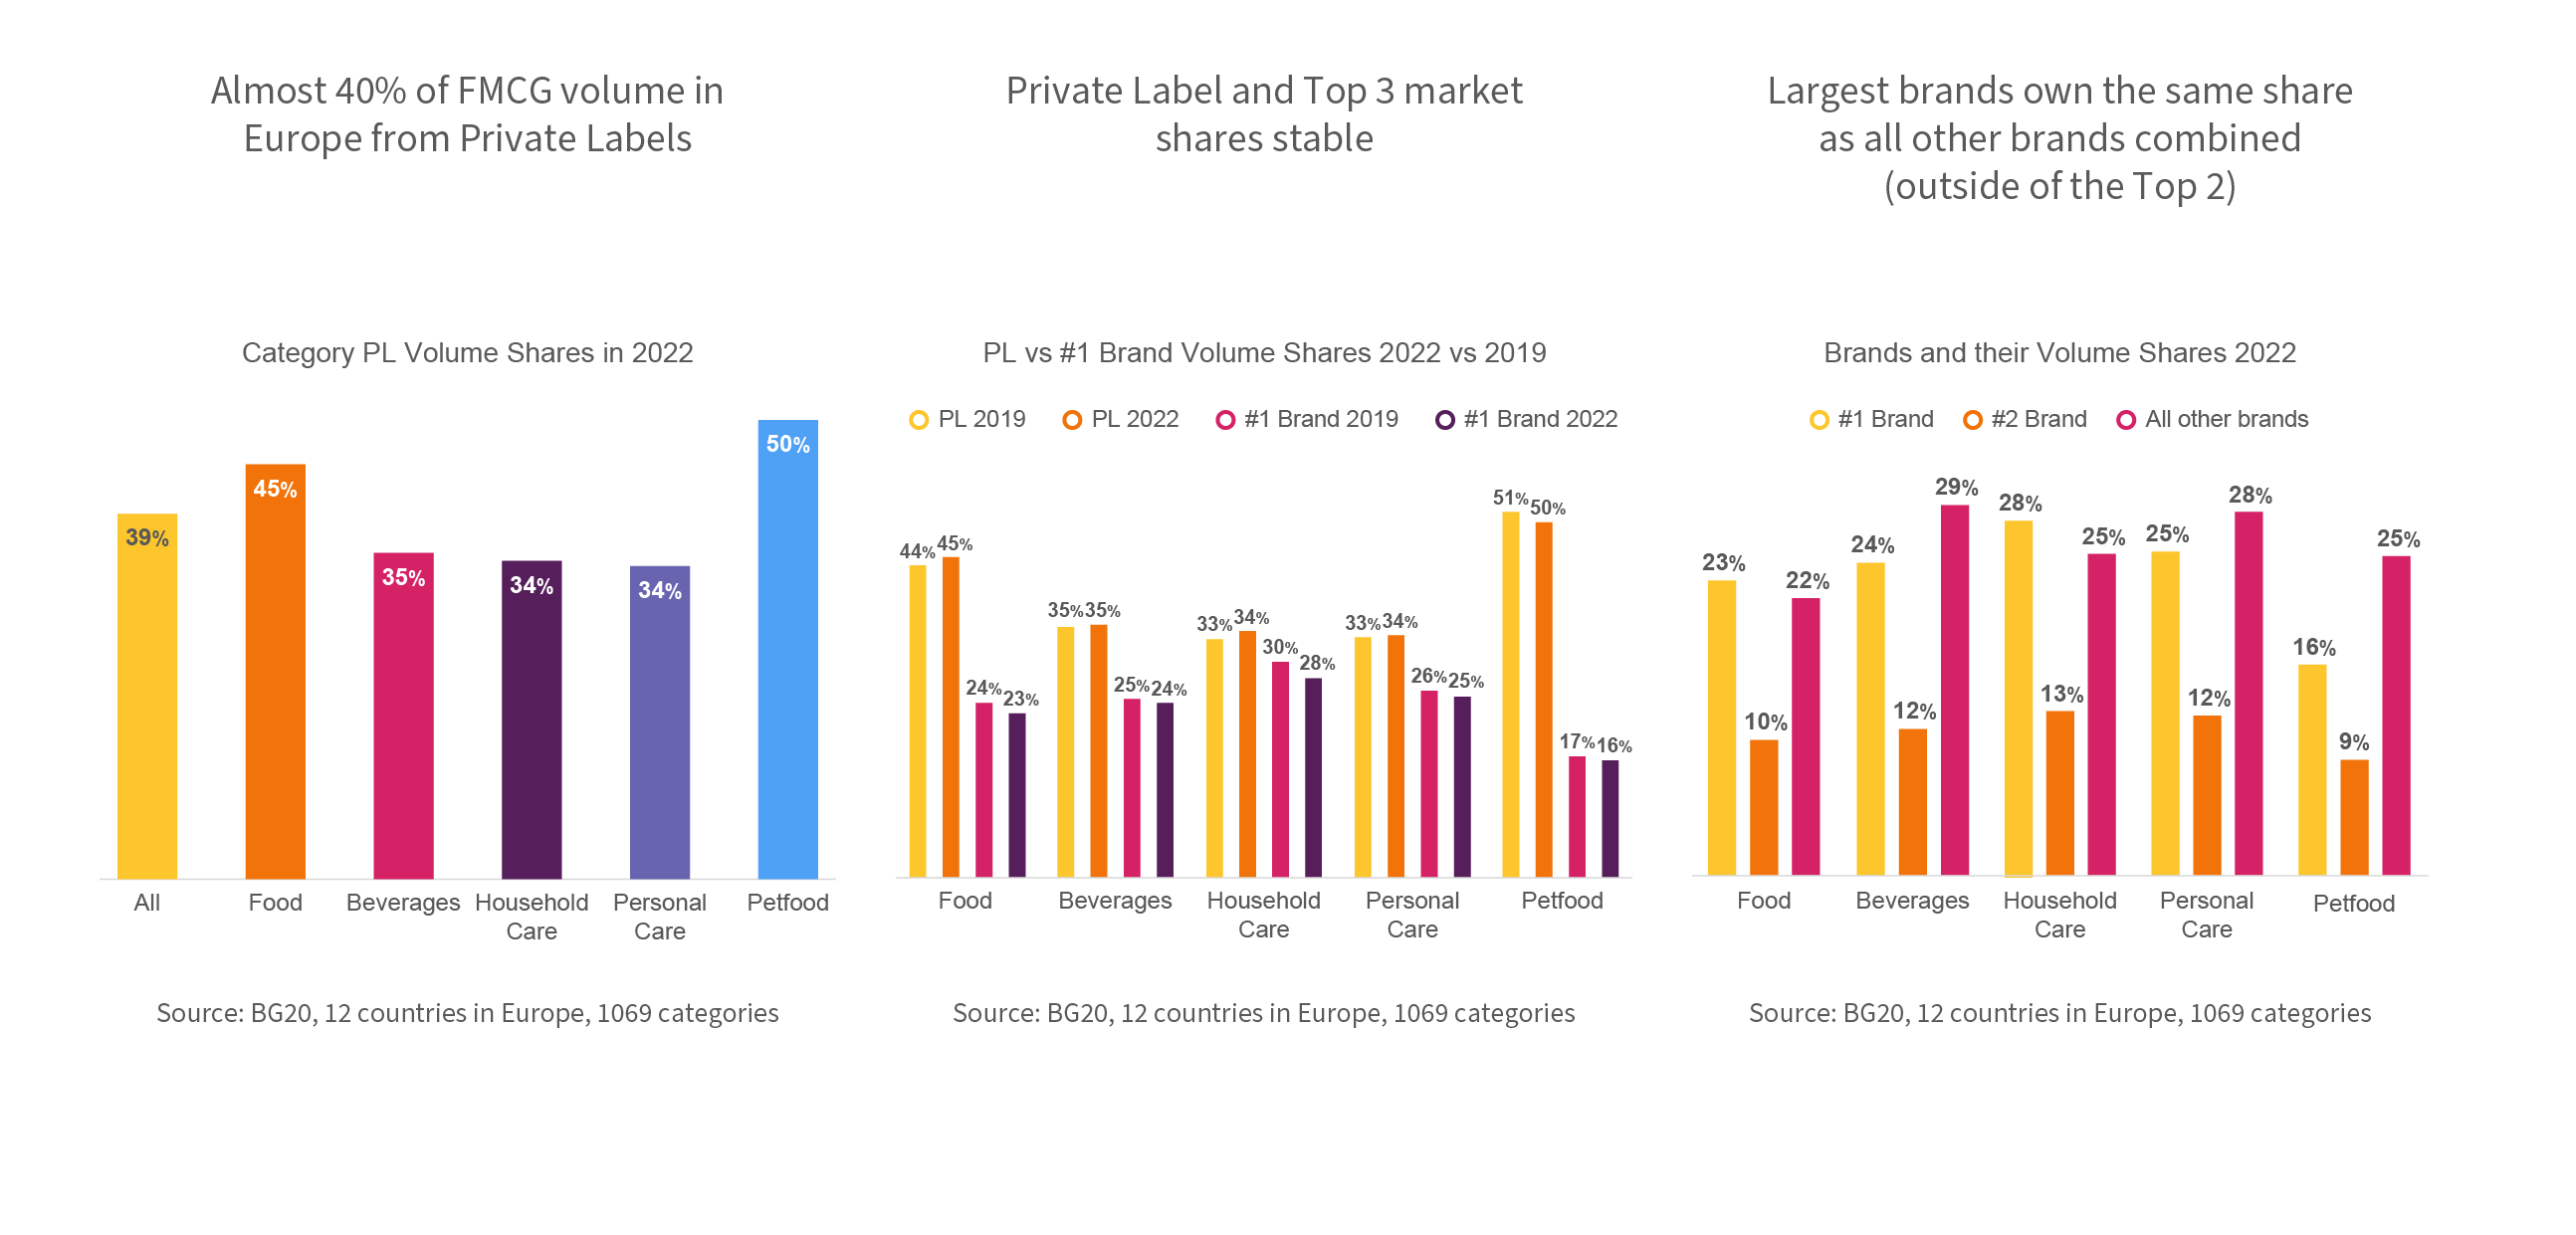
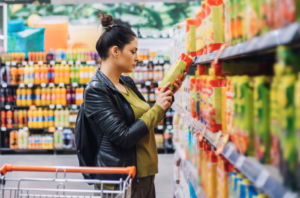
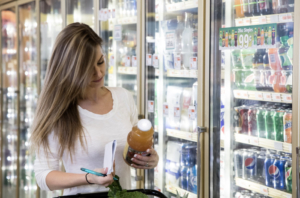
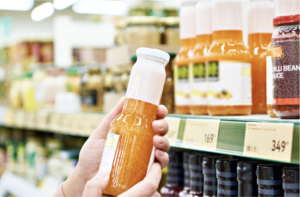
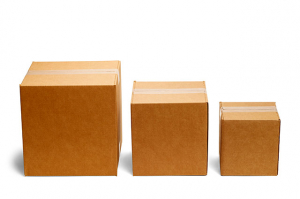
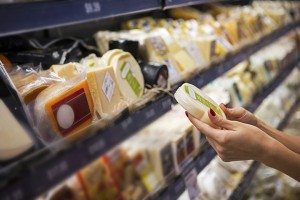
Almost 40% of FMCG volume in Europe from Private Labels
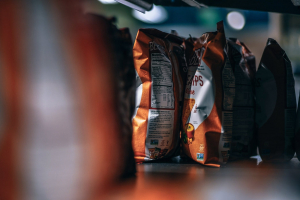
The FMCG market shows quite a distinct picture regarding the success of PLs in different types of categories. While brands and Private Labels own comparable slices of the pie in Petfood and Food, brands still outperform Private Labels two to one (in terms of volume share) in Personal Care, Household Care and Beverage categories. Value shares are still substantially higher given the price gap between NB and PL (more on this in two weeks).
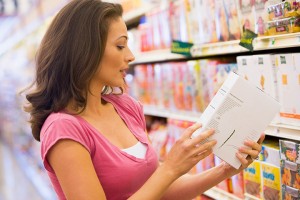
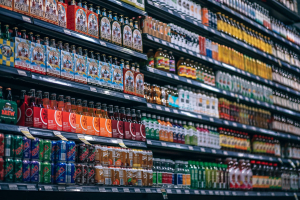
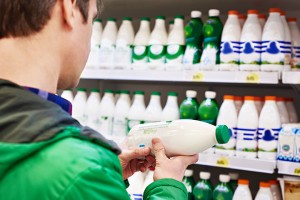
Private Label and Top 3 market shares stable
Across more than 1000 categories the average PL volume share has increased by 0.7% between 2019 and 2022, a change which was slightly more pronounced in Food (1.2%) and reversed in Petfood (minus 1.5%). The share of the category leading brand (which need not be the same in both 2019 and 2022, more on this next week) has dropped by 1.1% on average: most in Household care (minus 2.1%) and least in Petfood (minus 0.4%)
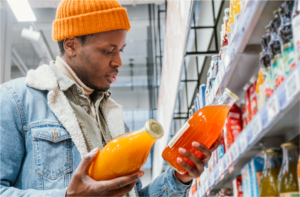
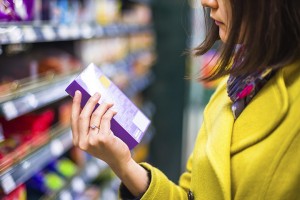
Largest brands own the same share as all other brands combined (outside of the Top 2)
The typical #1 brand sells about one quarter of the volume in a category. This amount roughly matches what all brands ranked #3 and lower contribute to total volume sales. The dominance of the #1 brand is most pronounced in food and household care categories where the leading brand sells 40% of the branded volume. Markets in Petfood are the least concentrated: the #1 brand gets about 33% of the total branded volume.