Stable price gap between NBs and PLs
Strong brands can benefit from higher reach and higher willingness-to-pay. The previous blog entry reports the (modest) gains PL has made in terms of value share captured from National Brands (NBs) over the past five years. How much of this share gain is a result of closing the price gap vs NBs?
On average across some 1,300 categories NBs charge 1.83 times the price of PLs, which is a small increase compared to 2015 when the average price premium was 77%.
Price premia of NBs, however, show substantial differences between categories. In personal care, NBs are sold at price levels which are 2.23 times more expensive than their PL competition. In food categories NB price premia are about half the size of personal care (58% compared to 123%).
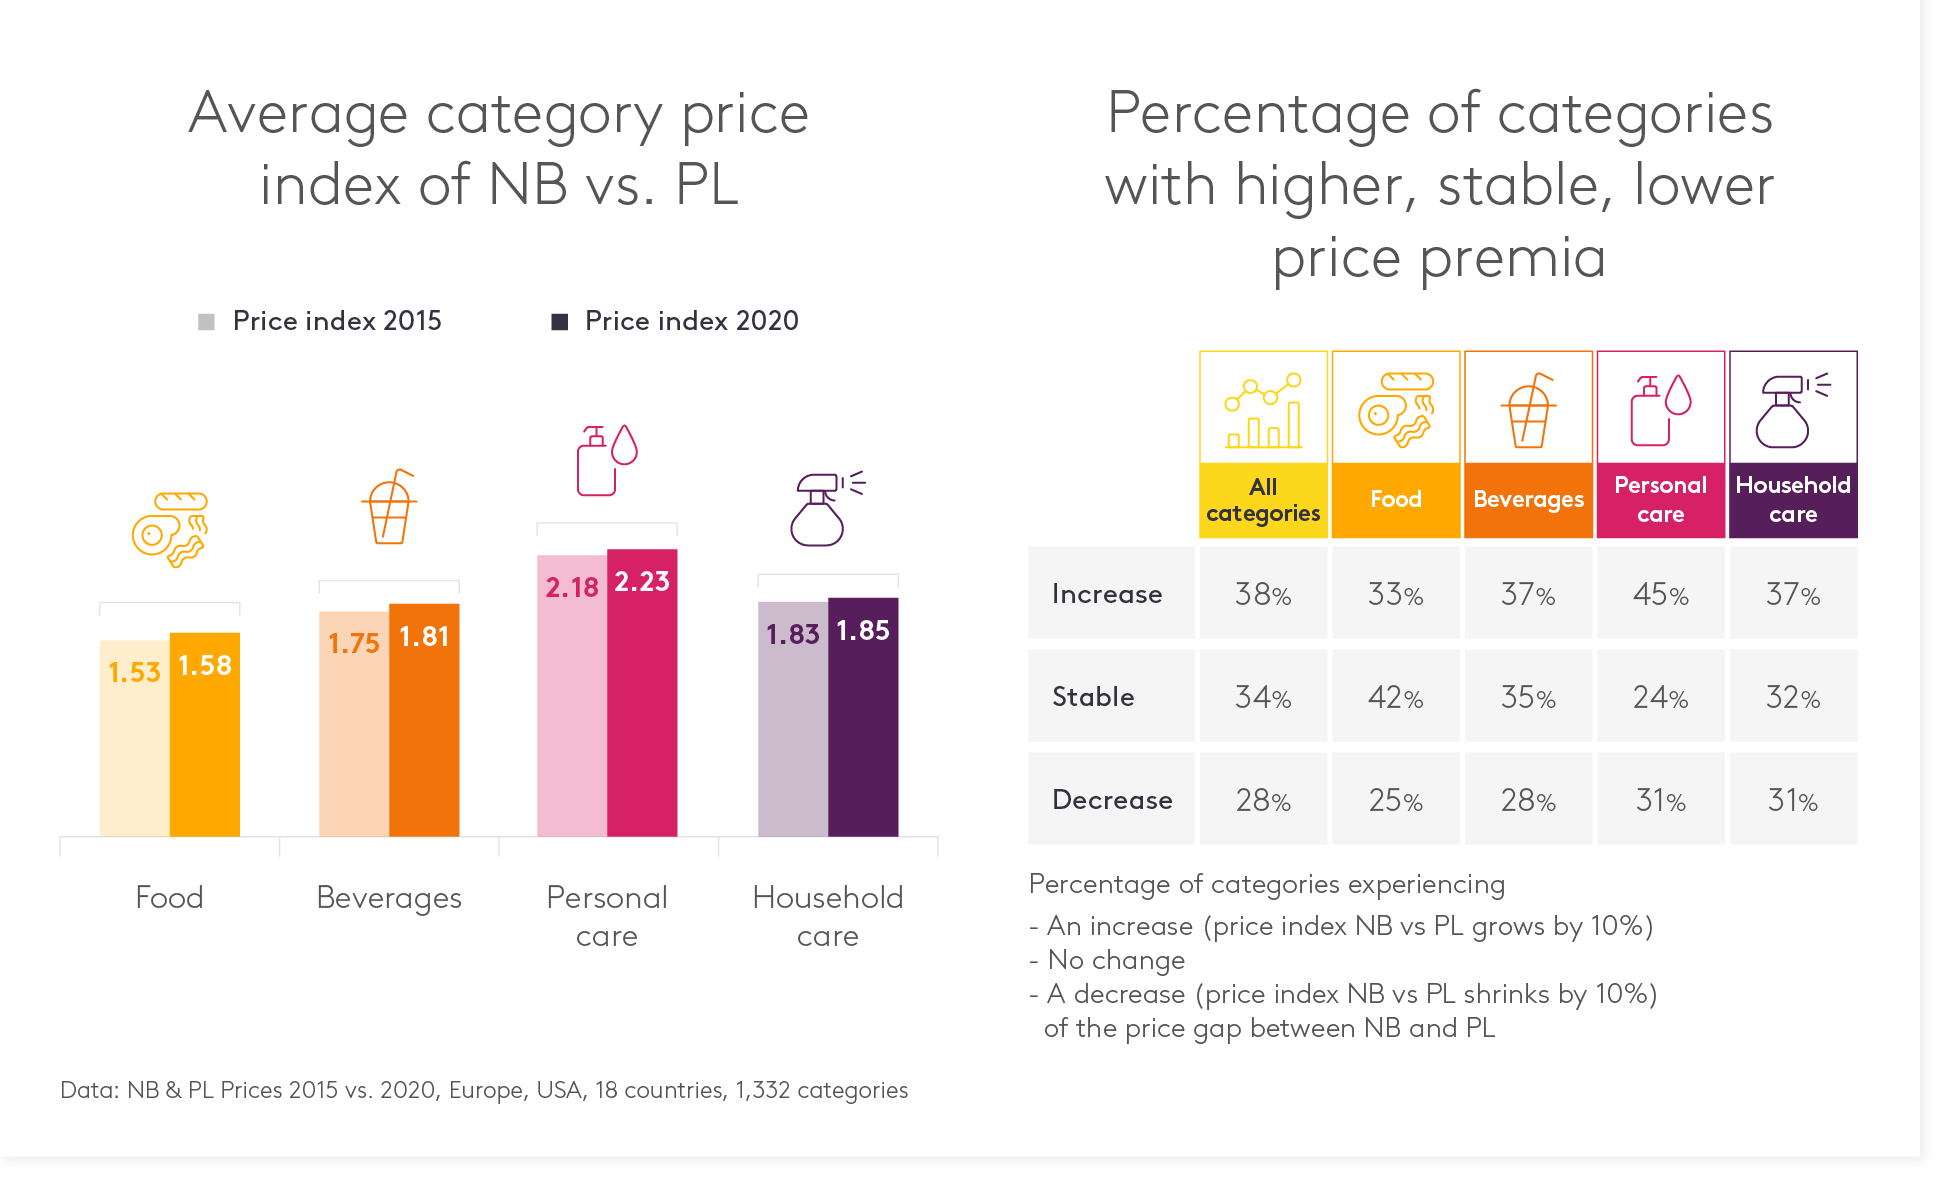 Looking at price premia dynamics between 2015 and 2020 we find that on average the price gap (modestly) increased in all category types. In 38% of all categories NB price premia increased by more than 10%, while they declined by the same margin in 28% of all categories.
Personal care categories, already boasting the highest price gaps, are most likely to show substantial increases (45% compared to 33% in food).
In summary, the gap between NB and PL prices has remained stable on average – we will explore in our next blog whether there is a link between the change in relative price levels of NBs and PLs and PL market share.
Data: NB & PL Prices 2015 vs. 2020, Europe, USA, 18 countries, 1,332 categories