What to expect from an innovation
The role of the category
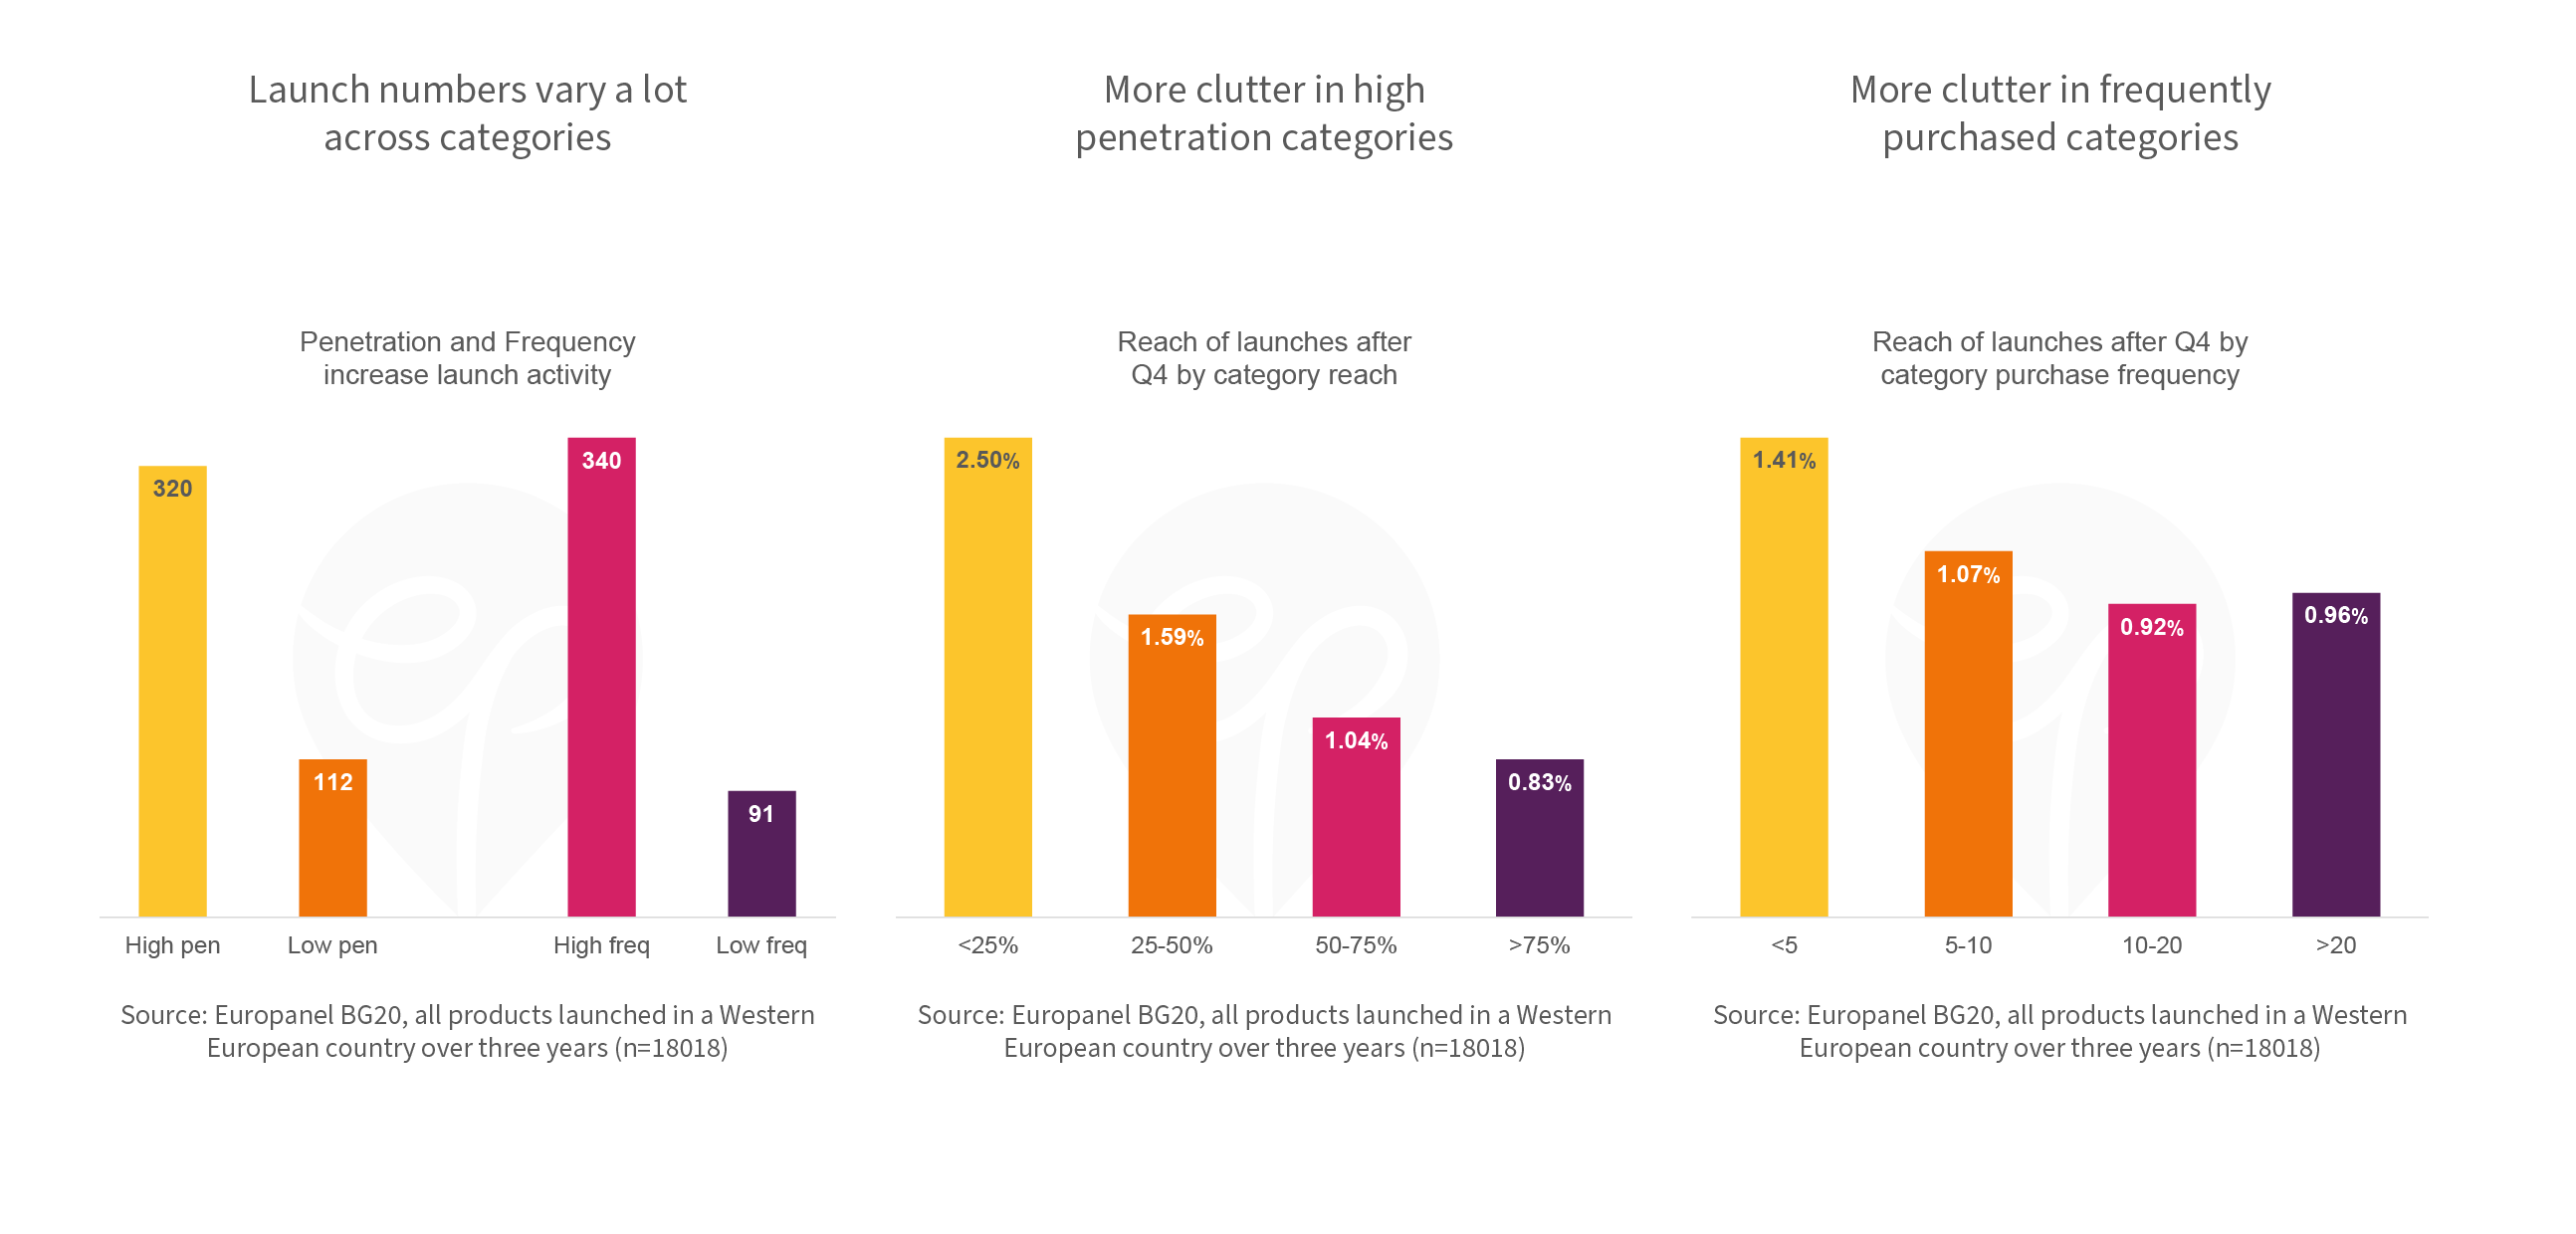
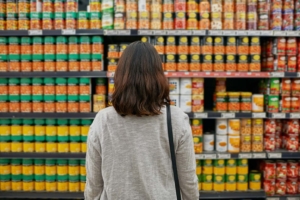
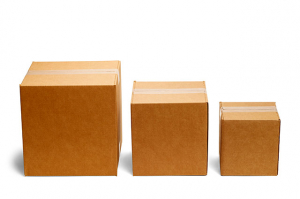
Launch numbers vary a lot across categories
Different categories show very different levels of innovation activity. The average category experienced 217 launches over a three year period, with about 1 in 5 categories launching more than 400 and less than 40 new products respectively. An important factor shaping the intensity of manufacturers’ and retailers’ launch intensity is the number of purchases in a category. As expected, the reach of a category is closely linked to the number of launches (correlation of 0.58) as is the average purchase frequency of the category (correlation = 0.64).
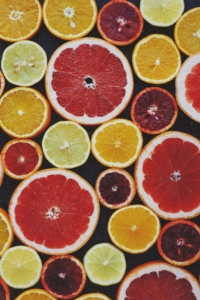
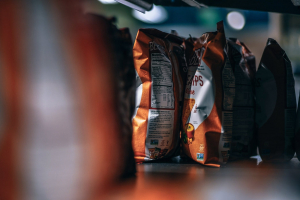
More clutter in high penetration categories
While the reach of a category increases the odds of finding a buyer for a given launch, we have also seen that high category reach is linked to the number of launches in that category. Hence launches in high reach categories face substantially more competition for shoppers willing to try new products. This factor explains the somewhat counterintuitive observation that launches in low reach categories can outperform launches in high reach categories after a year on the market.
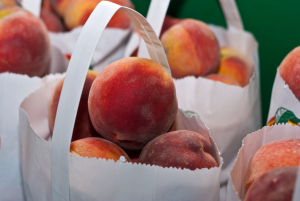
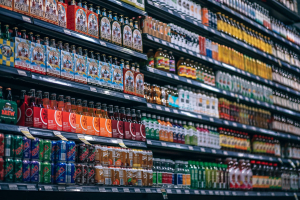
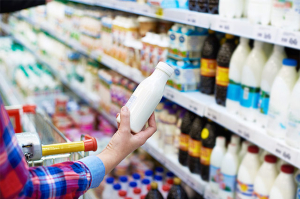
More clutter in frequently purchased categories
Like for penetration, we would also expect that high frequency buying of a category enhances the odds of finding buyers. At the same time, category purchase frequency is closely linked with the number of launches in a category. Put together, we see a pattern that aligns with the penetration findings: launches in more frequently purchased categories perform worse than their peers in less frequently purchased categories. Make sure you consider reach, frequency AND launch intensity when setting targets for your launches.